
Prompt Cache Misses: Five Checks Before Blaming Routing
Contents
- What should you check first when cache hits disappear?
- Which application settings and timing should you check?
- What can a gateway change between the client and provider?
- How do you investigate a cache regression in Synthorai?
- A measured session: find the regression, then inspect its spans
- How do native diagnostics help identify a changed request?
- When should you investigate the inference service itself?
- How do you prove that a fix worked?
- FAQ
- Does adding cache_control guarantee a hit?
- Can a cache miss be caused by routing even when the model name stays the same?
- Why do diagnostics say the request changed when some tokens were cached?
Diagnose prompt cache misses by checking usage first, then the reusable prefix, eligibility, timing and actual upstream destination against a known warm baseline.
TL;DR
- Missing cache usage is unknown; zero reported reads does not identify the cause.
- Request hit rate counts requests with any reuse; token reuse ratio measures how much input was reused.
- Native diagnostic states require different actions: fix a divergence, replace a missing baseline, or investigate an inconclusive comparison.
- DeepSeek requires matching persisted prefix units; a shared text prefix alone may not be sufficient.
What should you check first when cache hits disappear?
Start by checking whether the raw response actually contains cache usage. If the provider reports reads but the client or dashboard does not, investigate reporting first. Otherwise, preserve the last confirmed warm request and compare the failing request against it.
| First check | Evidence to collect | Smallest useful next action |
|---|---|---|
| Is the miss real? | Raw provider usage, client response and dashboard record | Check missing fields and streaming aggregation before changing prompts |
| Did the prefix change? | Ordered tools, system text and earlier messages | Compare components; move a changing timestamp or request ID after reusable content |
| Was the prefix eligible and written? | Model minimum, controls, read/write usage | Check the exact model and API; inspect the intended breakpoint |
| Was the request too early or too late? | Response-start time, request interval, cache lifetime | Run one sequential follow-up before testing parallel traffic |
| Did the destination change? | Effective model, service, account scope and fallback attempts | Ask the gateway operator to compare the actual upstream attempts |
Use two explicitly named metrics over requests with complete input/cache usage:
- Request hit rate = requests with more than zero cache-read tokens / requests with complete usage.
- Token reuse ratio = sum of cache-read tokens / sum of all input tokens, including cached input and cache writes.
Report missing-usage requests separately and include failed attempts in incident cost. Growing input can lower token reuse without changing request hit rate.
| Native API | Cache-read field | Total input used in the token-ratio denominator |
|---|---|---|
| OpenAI Responses | usage.input_tokens_details.cached_tokens | usage.input_tokens, which already includes cached input |
| Anthropic Messages | usage.cache_read_input_tokens | input_tokens + cache_read_input_tokens + cache_creation_input_tokens within usage |
| DeepSeek | usage.prompt_cache_hit_tokens | prompt_cache_hit_tokens + prompt_cache_miss_tokens within usage |
Use the gateway’s normalized schema when native fields have been converted; the Synthorai formula appears below.
Which application settings and timing should you check?
Check whether content changed before the expected reusable prefix: system timestamps, tool ordering and rewritten history are useful starting points.
Prefix mutation. Capture separate fingerprints (hashes used to detect changes) for ordered tool definitions, stable system text and earlier message blocks. Keep a request-specific marker at the end. A hash of the entire request will change during normal append-only conversation growth and cannot locate the first difference. JSON whitespace outside text is also different from whitespace inside a model-visible string.
Inspect retrieval placement, mode switches, compaction and the final framework request. For multimodal inputs, compare preprocessing and file references.
Eligibility and controls. A breakpoint marks the end of a prefix requested for caching. The time to live (TTL) is the cache entry’s configured lifetime.
A long total request does not guarantee that the selected reusable prefix meets the model’s minimum. For explicit breakpoints, check the content before the breakpoint. Adding cache_control cannot make an otherwise ineligible prefix reusable. On Anthropic, inspect automatic versus block-level controls, TTL conflicts and breakpoint limits; an invalid combination may produce HTTP 400, meaning the request was rejected, instead of a successful response with zero cache reads. Anthropic prompt caching.
Readiness and expiration. Sending a burst of identical requests before the first write becomes available can create several cold requests. Anthropic documents availability after the first response starts. Send one follow-up after the first response starts to establish a warm baseline, then compare parallel requests using their response-start timestamps. For an idle conversation, compare the interval with the configured cache lifetime and any documented refresh behavior. Anthropic cache availability.
DeepSeek persistence units. DeepSeek matches complete persisted prefix units, which are saved portions of prior context. Its documented example starts with A+B, followed by A+C: the second request cannot reuse the complete A+B unit. After the service detects and persists common prefix A, a third request A+D can reuse that unit. Here A is stable context and B, C and D are different suffixes. This is a vendor-documented mechanism, not our measurement.
For this pattern, preserve A exactly, complete the first two sequential requests, allow for persistence taking seconds, then inspect the third request’s hit/miss token fields. Waiting alone does not ensure that the desired common-prefix unit has been created, and caching remains best-effort. DeepSeek persistence rules.
What can a gateway change between the client and provider?
A gateway can change both the effective request and the evidence returned to the client. Check those separately before attributing a regression to routing.
Check model aliases, credential scope, policy overrides and fallback attempts. For protocol conversion, inspect the outbound controls and returned native fields; for streaming, compare upstream usage events with final client usage.
Cross-vendor routing drift. Balancing or failover can move the same public model between inference vendors with separate caches. A prefix warmed at vendor A is then unavailable at vendor B. Our provider-drift study observed nine upstreams and 4/20 request hits, versus 19/20 on its single-backend comparison. This describes that historical configuration.
Group attempts by vendor, model and account scope. Compare cache reads within each group with stable prefixes and intervals, including failures and fallback destinations. Ask the operator to verify affinity (routing related requests consistently) and failover. Repeat after an approved adjustment. Vendor changes establish drift; individual misses still require timing and eligibility checks.
Synthorai requests have no provider/channel selector.
How do you investigate a cache regression in Synthorai?
Use Analytics for workload trends and Logs for requests. Labels were verified live on November 6, 2026.
- Narrow the workload. In Analytics, select
Time rangeandAll keys · all models. In Logs, useAdd filterwithmodelorkey. Keep selections consistent between normal and affected intervals.CACHE HITis a token reuse ratio, not a request hit rate. - Inspect the request. In
Overview, compare Input, Cache read, Output and applicable writes inCost at your rate. Stable reads with growing input suggest context growth; falling reads and rising writes suggest checking prefix and timing.Rawcontains stored fields, not the original provider response. - Follow the trace and session. From the affected Logs request, select
Open trace, thenOpen session. InTraces in this session, compare tasks and open the zero-reuse trace. Click each span (individual operation) to inspect cache reads/writes and charges; the waterfall alone does not show cache reuse. Use Logssessionortracefilters for the underlying records. Preserve links, timestamps and native response IDs for escalation.
Send X-Session-Id per conversation, X-Trace-Id per task and X-Span-Id per operation. Group by model and intended shared prefix before interpreting cache trends.
Correlation and routing are separate: X-Session-Id also takes precedence over the body cache key for gateway affinity; X-Trace-Id only groups observations. Keep session identity stable during comparisons. Neither guarantees shared cache or a fixed destination; do not group unrelated conversations to chase hits.
For complete Synthorai stored records, calculate token reuse as:
cache reads = cached_tokens + explicit_cached_tokens
input total = prompt_tokens + explicit_cached_tokens + cache_write_tokens
reuse ratio = sum(cache reads) / sum(input total)
Here cached_tokens is already included in prompt_tokens; adding it again would double-count input. Cache writes belong in the denominator, not the numerator. Exclude missing-usage records and report their count separately; a stored zero alone cannot prove that the upstream supplied a measured zero.
A measured session: find the regression, then inspect its spans
Following our agent-cost investigation, we sent six sequential Responses requests through Synthorai on November 6, 2026, using GPT-6.1 Sol. One session contained three traces, each with two calls labeled lookup-1 and lookup-2. These label synthetic model calls; no lookup tool was executed. Model, tools and session ID stayed fixed. The regression prepended a fresh timestamp-like value on each request; repair restored the original prefix. Request markers stayed at the tail.
| Trace | Input tokens | Cache reads | Reuse | Reported cost |
|---|---|---|---|---|
| baseline | 4,729 | 2,273 | 48.1% | $0.0063923 |
| regression | 4,764 | 0 | 0% | $0.0119350 |
| repair | 4,732 | 4,546 | 96.1% | $0.0009446 |
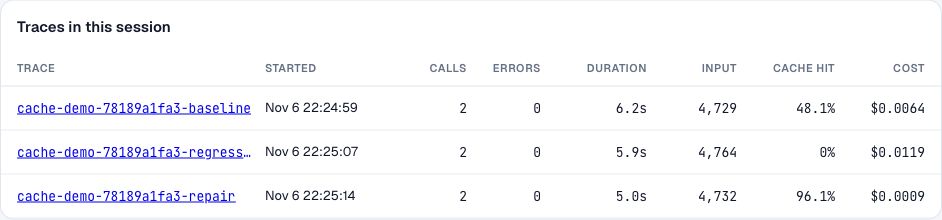
In Traces in this session, open the zero-reuse regression row. The baseline includes a cold first call; repair reuses an already warm prefix. This six-call demonstration shows the injected failure and recovery, not an expected production savings rate. Session-wide reuse is 6,819 / 14,225 = 47.9%; that average hides the regression.

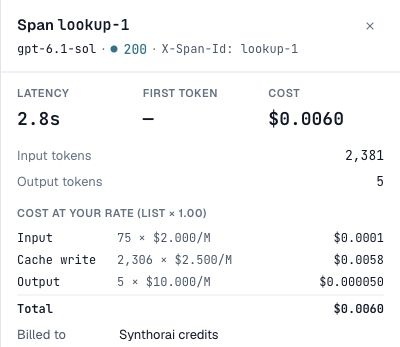
Select lookup-1 in the waterfall. Its detail shows 2,306 cache-write tokens out of 2,381 input tokens, consistent with rebuilding the changed prefix. The stored synthetic requests establish the injected difference; the timeline alone cannot identify it. Use Open in Logs for the request record and compare application-side prefix fingerprints.
This demonstration did not request native diagnostic comparisons. The injected prefix change and reported usage establish the observed regression and recovery; actual vendor continuity was not independently verified. Session identity stayed fixed, so the experiment does not measure an affinity benefit.
For BYOK, distinguish provider-reported and estimated cost before invoice reconciliation. Obtain operator evidence for unavailable destination/fallback details.
How do native diagnostics help identify a changed request?
Native diagnostics identify request differences; usage measures reported reuse. Read them together. The selected gateway path must support and preserve the native fields. Our earlier Synthorai comparison probe returned no diagnostics, so supplier documentation alone does not establish gateway availability.
OpenAI Responses accepts prompt_cache_options.comparison_response_id on supported models. Keep the completed baseline response ID and submit the actual follow-up content; the comparison reference does not load conversation history. Results appear in prompt_cache_diagnostics, including the response.completed event when streaming. Use the states below to choose the next action. Diagnostic token estimates are separate from billed usage. OpenAI cache diagnostics.
Anthropic Messages uses diagnostics: {"previous_message_id": null} for initial opt-in, followed by the previous native message ID on subsequent opted-in requests. Streaming exposes the result in message_start. Interpret a null result only after checking that both requests opted in and the follow-up supplied a real reference. Anthropic documents diagnostics for the Claude API, excluding Amazon Bedrock and Google-managed Claude. Anthropic cache diagnostics.
| API and returned state | Meaning | Next action |
|---|---|---|
OpenAI cache_hit | No miss detected by comparison | Read usage to quantify reuse; new suffix tokens can still require processing |
OpenAI cache_miss | A classified difference affected expected reuse | Inspect reason, fix the intended component, then compare again |
OpenAI comparison_response_not_found | Baseline record missing or expired | Choose a recent completed response in the same organization |
OpenAI unavailable | Unsupported or inconclusive comparison | Verify model support; try a recent reference, then use manual checks if persistent |
Anthropic diagnostics: null | No divergence only when a valid opted-in comparison ran; also returned without opt-in or on the first turn | Verify opt-in/reference first; with a valid match and low reads, check cache availability |
Anthropic cache_miss_reason: null inside a diagnostics object | Comparison pending | Check the next opted-in turn; do not classify the pending result as a miss |
Anthropic reason type *_changed | First identified divergent component | Fix that component and compare again; later differences may remain |
Anthropic previous_message_not_found | No retained baseline fingerprint | Check opt-in on the prior request, organization/workspace and elapsed time; establish a fresh baseline |
Anthropic unavailable | No conclusive comparison, including some other parameter changes or comparison limits | Compare effective tool_choice, thinking/output settings and beta headers; use manual checks if persistent |
| Diagnostic field absent on either API | Missing evidence | Check API/model support, request options, conversion and streaming event capture |
OpenAI’s prompt_cache_key_changed needs special care: usage may report a miss without a physical cache miss. Check whether the key changed intentionally for separate accounting before attributing the result to cache availability. Keep the key stable within the intended accounting group, while also checking its gateway affinity role. OpenAI diagnostic reasons.
When should you investigate the inference service itself?
Investigate cache availability after confirming eligible content, valid timing, comparable destination scope and trustworthy usage. Even then, unchanged input does not guarantee that a reusable entry is present.
Possible explanations include expiration, incomplete persistence, capacity pressure and service-side scheduling. OpenAI documents cache routing and availability constraints; a session label does not guarantee access to a particular worker. A partial hit can also mean that an earlier prefix remains reusable while later content must be processed. OpenAI prompt caching.
A slow first token or zero reads cannot prove a cluster switch. Escalate native response IDs, timestamps, intervals and destination labels; leave the mechanism unresolved without provider evidence.
Explicit cache resources add a different check: inspect the referenced object’s existence, expiration and scope. Do not diagnose a stale explicit resource ID with the same assumptions used for automatic prefix caching.
How do you prove that a fix worked?
Compare normal, affected and repaired traffic using usage, diagnostics and destinations.
Include retries in cost. A reporting fix should reconcile native and client usage. A prefix fix should remove the difference and restore comparable reuse. A routing fix should confirm the intended destination and recovery within that scope. If the relevant condition fails, retain the unresolved classification and continue from the remaining evidence.
FAQ
Does adding cache_control guarantee a hit?
Cache controls remain subject to prefix length, placement, readiness and lifetime. Check model requirements and raw usage.
Can a cache miss be caused by routing even when the model name stays the same?
A stable client model name can resolve to different vendors, models or account scopes. Compare actual attempts with the gateway operator, using the provider-drift runbook.
Why do diagnostics say the request changed when some tokens were cached?
A change late in the request can leave an earlier prefix reusable. Read the changed component alongside absolute cache-read tokens. Diagnostic comparison and cache accounting describe different aspects of the request.
For related investigations, see the gateway cache audit, cache-write economics and compaction timing.